
6 Flow Cytometry
Imagine you have a big jar filled with different colored marbles, and your task is to sort them by color. Now, imagine each marble represents a cell in your body, and instead of colors, we’re interested in different properties of these cells, like size, shape, and what molecules they have on their surface.
Flow cytometry is like a super-fast and super-smart way of doing this sorting. Instead of sorting marbles by hand, we use a machine that can examine each cell as it passes through a tiny tube. This machine can shine different colored lights on the cells and detect how they reflect or emit light.
Each type of cell will react differently to these lights based on their unique properties. So, as the cells flow through the tube, the machine quickly analyzes them and sorts them into different categories based on their properties.
Flow cytometry can check out anywhere from 500 to 10,000 cells in just one second. That’s like checking the colors of 500 to 10,000 cars zooming by on a highway every second!
Scientists use flow cytometry a lot when they’re studying samples from our immune system. You know, like how our body fights off germs and stuff. It helps them understand what’s happening in our immune system by looking closely at the different types of cells involved. It’s like using a powerful microscope to see tiny details about how our bodies work to keep us healthy.
6.1 Flow Cytometer
Flow cytometers are machines that scientists use to study cells. There are two main types: analyzers and sorters.
Analyzers, as the name suggests, analyze cells. They can measure different things about the cells, like their size, shape, and what molecules they have on their surface. It’s like using a high-tech scanner to take a detailed picture of the cells.
Sorters, on the other hand, not only analyze cells but can also physically sort them into different groups based on their properties. It’s like having a machine that not only takes pictures of different toys but can also pick out specific toys and put them in separate bins.
Now, here’s an important thing to remember: all flow cytometers are analyzers, but not all analyzers are sorters. It’s a bit like saying all cats are animals, but not all animals are cats.
6.1.1 Typical Setup of a Flow Cytometer
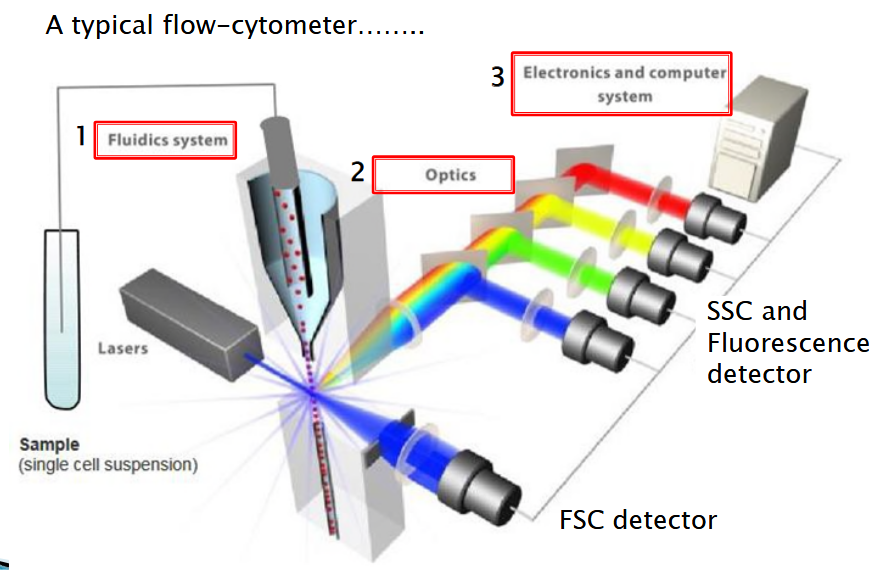
Firstly, there’s the fluidics system. This part carries samples or cells in a fluidic stream, kind of like a tiny river, to the laser beam for examination. It ensures a steady flow of cells so they can be analyzed efficiently.
Then, there’s the optics component. This consists of lasers that shine light onto the particles in the sample streams. Think of it as the flashlight that helps you see better in the dark. Additionally, there are optical fibers that direct the resulting light signals to the appropriate detectors. These detectors capture the signals emitted by the cells when they’re illuminated, allowing scientists to gather valuable information about the cells’ properties.
Next up, we have the electronics. This part of the flow cytometer converts the detected light signals into electronic signals that can be understood and processed by the computer. It’s like translating a foreign language into something you can understand. For some advanced instruments equipped with a sorting feature, the electronics system can also make decisions about sorting. It can charge and deflect particles based on the information gathered during analysis.
6.1.1.1 Optical System

The optics subsystem plays a crucial role in channeling laser power and focusing it precisely onto the sample stream. Think of it like a set of lenses and mirrors in a camera that direct and focus light onto the subject you’re photographing. Similarly, in a flow cytometer, the optics system includes components like lenses, mirrors, and prisms that manipulate the laser beams emitted by the lasers.
6.1.1.2 Electronics System

This system helps transform light signals into electric signals.
6.2 Principles of Flow Cytometry
Flow cytometry operates on several key principles to efficiently analyze cells. One of these principles is hydrodynamic focusing, which involves speeding up randomly arranged particles, like cells in a fluid, and directing them towards the center of the sample core. This process aligns the particles in a single file, making it easier for the machine to examine them one by one. It’s like herding a group of animals into a single line, so you can inspect each one more closely.
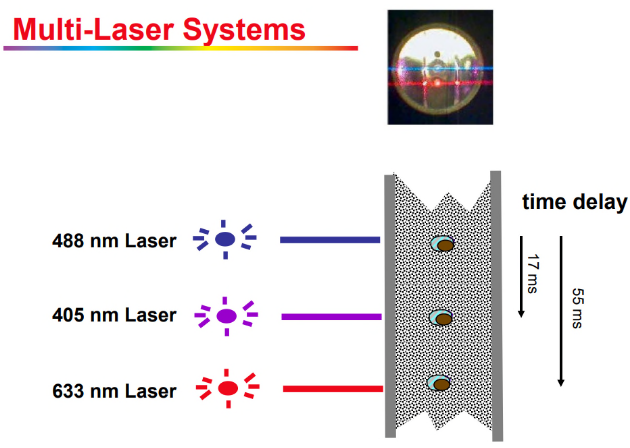
Once the particles are aligned, flow cytometry uses different laser wavelengths to shine light on them. These lasers specifically target fluorescence-labeled particles, causing them to emit light signals that can be detected by sensors. It’s similar to shining different colored lights on objects to see how they reflect or glow. By collecting these fluorescence signals, the machine can gather information about the characteristics of each individual particle, such as what molecules they have on their surface.
In flow cytometry, after the fluorescence signals are detected from each particle, the software does something pretty neat. It collects the fluorescence signal data from one particle at different timed points and puts it all together as a single event. It’s like taking snapshots of a moving object at different moments and then combining them to get a complete picture.
This means the software can capture multi-fluorescence data from one cell or particle. So, instead of just seeing one aspect of the particle, like its color, at a time, the software can gather information about multiple characteristics simultaneously.
6.2.1 Measurable Events
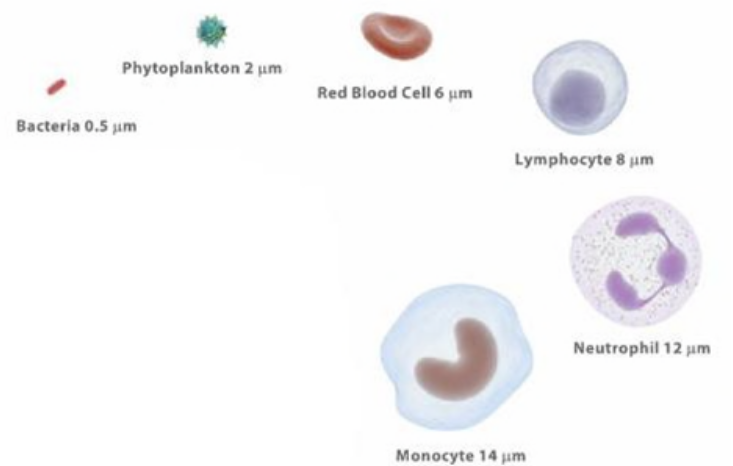
The neat thing about flow cytometry is that it’s able to measure super small items that even go as small as 0.1 to 100 \(\mu\)m.
6.3 Quantifiable Parameters
6.3.1 Physical Parameters
6.3.1.1 Forward Scattering

One of the physical parameters measured in flow cytometry is called Forward Scatter (FSC). This refers to the scattering of light in the same direction as the laser beam. Imagine shining a flashlight straight ahead and seeing how the light reflects off an object and back toward you. Similarly, in flow cytometry, the laser beam shines onto a cell, and the light that scatters forward is captured and measured.
The amount of light scattered in the forward direction can tell scientists about the size and shape of the cell. Larger cells tend to scatter more light, while smaller cells scatter less.
6.3.1.2 Side Scattering
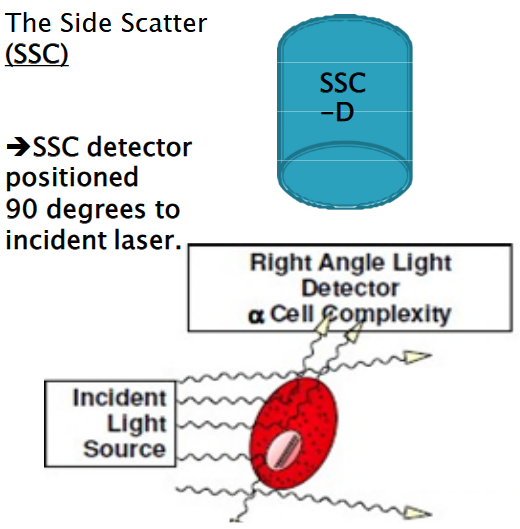
Another important physical parameter is Side Scatter (SSC). This refers to the scattering of light at a 90-degree angle to the path of the incident laser beam. Imagine shining a flashlight onto an object and observing how some of the light scatters to the side. Similarly, in flow cytometry, the laser beam hits a cell, and the light that scatters sideways is captured and measured by a detector positioned at a 90-degree angle to the incident laser.
The amount of light scattered to the side, or side scatter, provides information about the internal complexity or granularity of the cell. Cells with more internal structures or granularity scatter more light to the side, while smoother cells scatter less.
6.3.2 Fluoresence
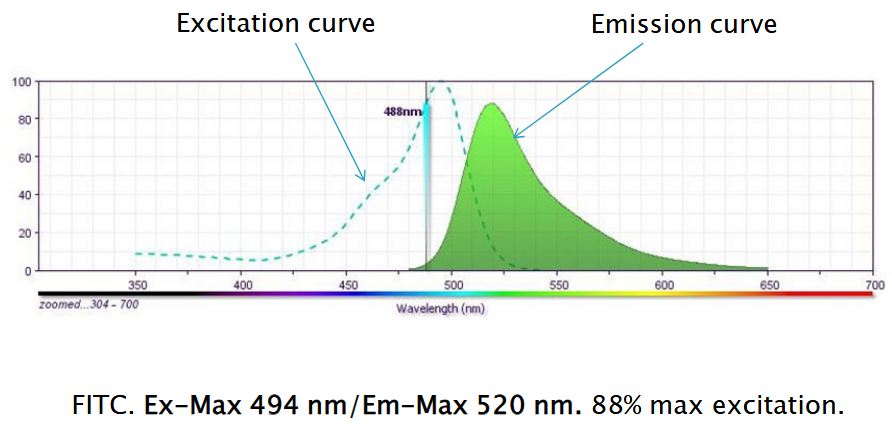
The principle of fluorescence in flow cytometry involves using fluorescent molecules to tag or label target cells. Just like putting a sticker on an object to make it stand out, scientists attach fluorescent molecules to specific parts of cells they want to study. These fluorescent tags emit light when they’re excited by a laser beam of a particular wavelength.
When the tagged cells pass through the flow cytometer and are exposed to the laser light, the fluorescent molecules on the cells become excited and emit light of their own, which can be detected by the instrument.
6.3.2.1 Choice of Fluorochromes
The choice of fluorochromes is crucial in flow cytometry for several reasons. Firstly, different fluorochromes emit light at specific wavelengths, or “channels,” when excited by the laser in the flow cytometer. If multiple fluorochromes emit light in the same channel, it can cause overlap and make it challenging to accurately distinguish between them.
Secondly, fluorochromes can reveal important biological information about the cells being studied.
6.3.2.2 Compensation
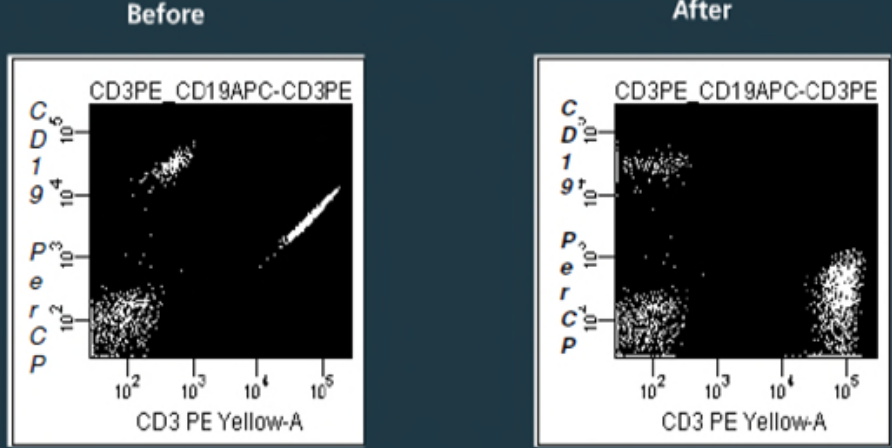
Compensation is a critical aspect of flow cytometric analysis that ensures accurate interpretation of data. When fluorescently labeled cells are analyzed in a flow cytometer, some of the emitted light may bleed into adjacent detection channels due to spectral overlap between fluorochromes. This can lead to inaccurate measurements and misinterpretation of the data if not properly corrected.
Compensation is the process of correcting for this spectral overlap by adjusting the fluorescence signal detected in each channel. Essentially, it involves subtracting the contribution of each fluorochrome from the signal detected in other channels to isolate the true fluorescence signal.
Properly compensated data ensures that the fluorescence signals measured in each channel accurately represent the amount of fluorescence emitted by the labeled cells, without interference from neighboring channels.
6.3.2.3 Stain Index
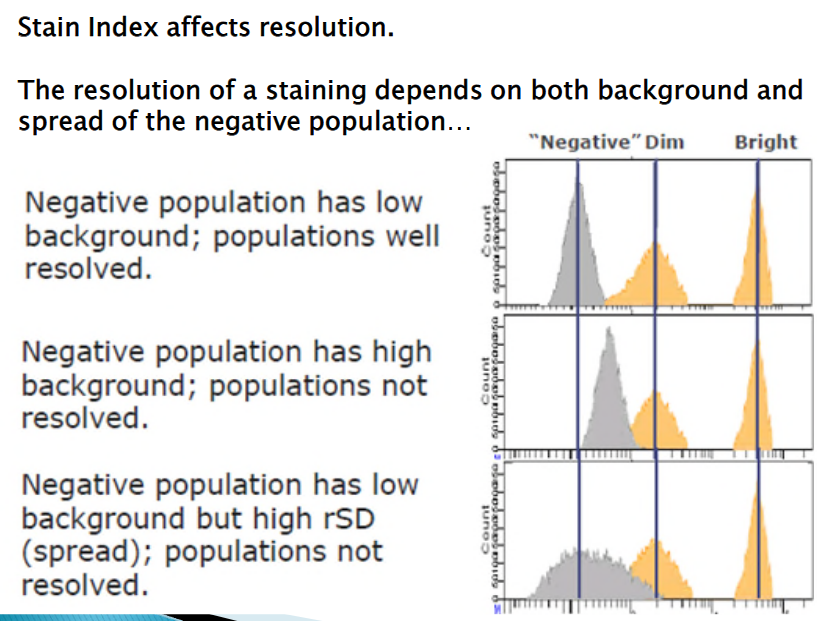
Quantitating the brightness of fluorescent reagents in flow cytometry is crucial for accurately analyzing cell populations. The Stain Index (SI) provides a normalized metric for this purpose, helping to assess the fluorescence intensity relative to the background signal.
The Stain Index formula calculates the difference between the median fluorescence intensity (MFI) of the positive population and the MFI of the negative population. This difference is then divided by two times the robust standard deviation (rSD) of the negative population.
6.3.3 Antigen Density
Antigen density refers to the amount of a specific antigen expressed on the surface of a cell. Antigens are proteins or molecules that can trigger an immune response in the body, and their expression levels can vary depending on factors such as cell activation and function.
When analyzing cells using flow cytometry, antigen density is an important parameter to consider. It provides insights into the characteristics and behavior of the cells being studied. For example, cells that are highly activated or involved in certain functions may express higher levels of specific antigens compared to resting cells.
Antigen expression can be visualized and analyzed in flow cytometry using various plots. In a cluster plot, antigen expression may appear relatively uniform across a population of cells, indicating homogeneous expression within that cell type. On the other hand, in a smear plot, antigen expression may be more variable, with a range of expression levels observed across the cell population.